How did Houten Build a World-Class Planned Town?
The Dutch town that planned green first, cars last, and maintenance permanently
Urban Planning
Netherlands
Tamil Nadu
Finance
Engineering
Civil Engineering
Introduction
Many Indians who have been abroad do notice the stark difference between their own cities and well planned cities around the World. The discussions usually end up with complaints, about the lack of proper urban planning in Indian cities. In those discussions, people often point out the lack of green spaces, poor pedestrian infrastructure, and inadequate public transportation. Many of these issues are interconnected and can be addressed through comprehensive urban planning strategies.
I decided to explore:
- How well planned towns work?
- What makes them livable?
- What could be done to improve urban planning in towns of India?
In this post, I focus on only the first question. For answering the first question, I will only focus on the case of Houten, a Dutch town that has successfully implemented world-class urban planning.
The Netherlands has a population of about 18.4 million people living in 12 provinces, among West, South, East and North regions. Houten is located in Utrecht, province. From Amsterdam, it is about 45 minutes by Car and 20 mins from Utrecht city. Urbanism is meticulously understanding the environment, and designing encompassing, physical form of cities, town planning, and the distinct cultural ways of life experienced by people living in the city.
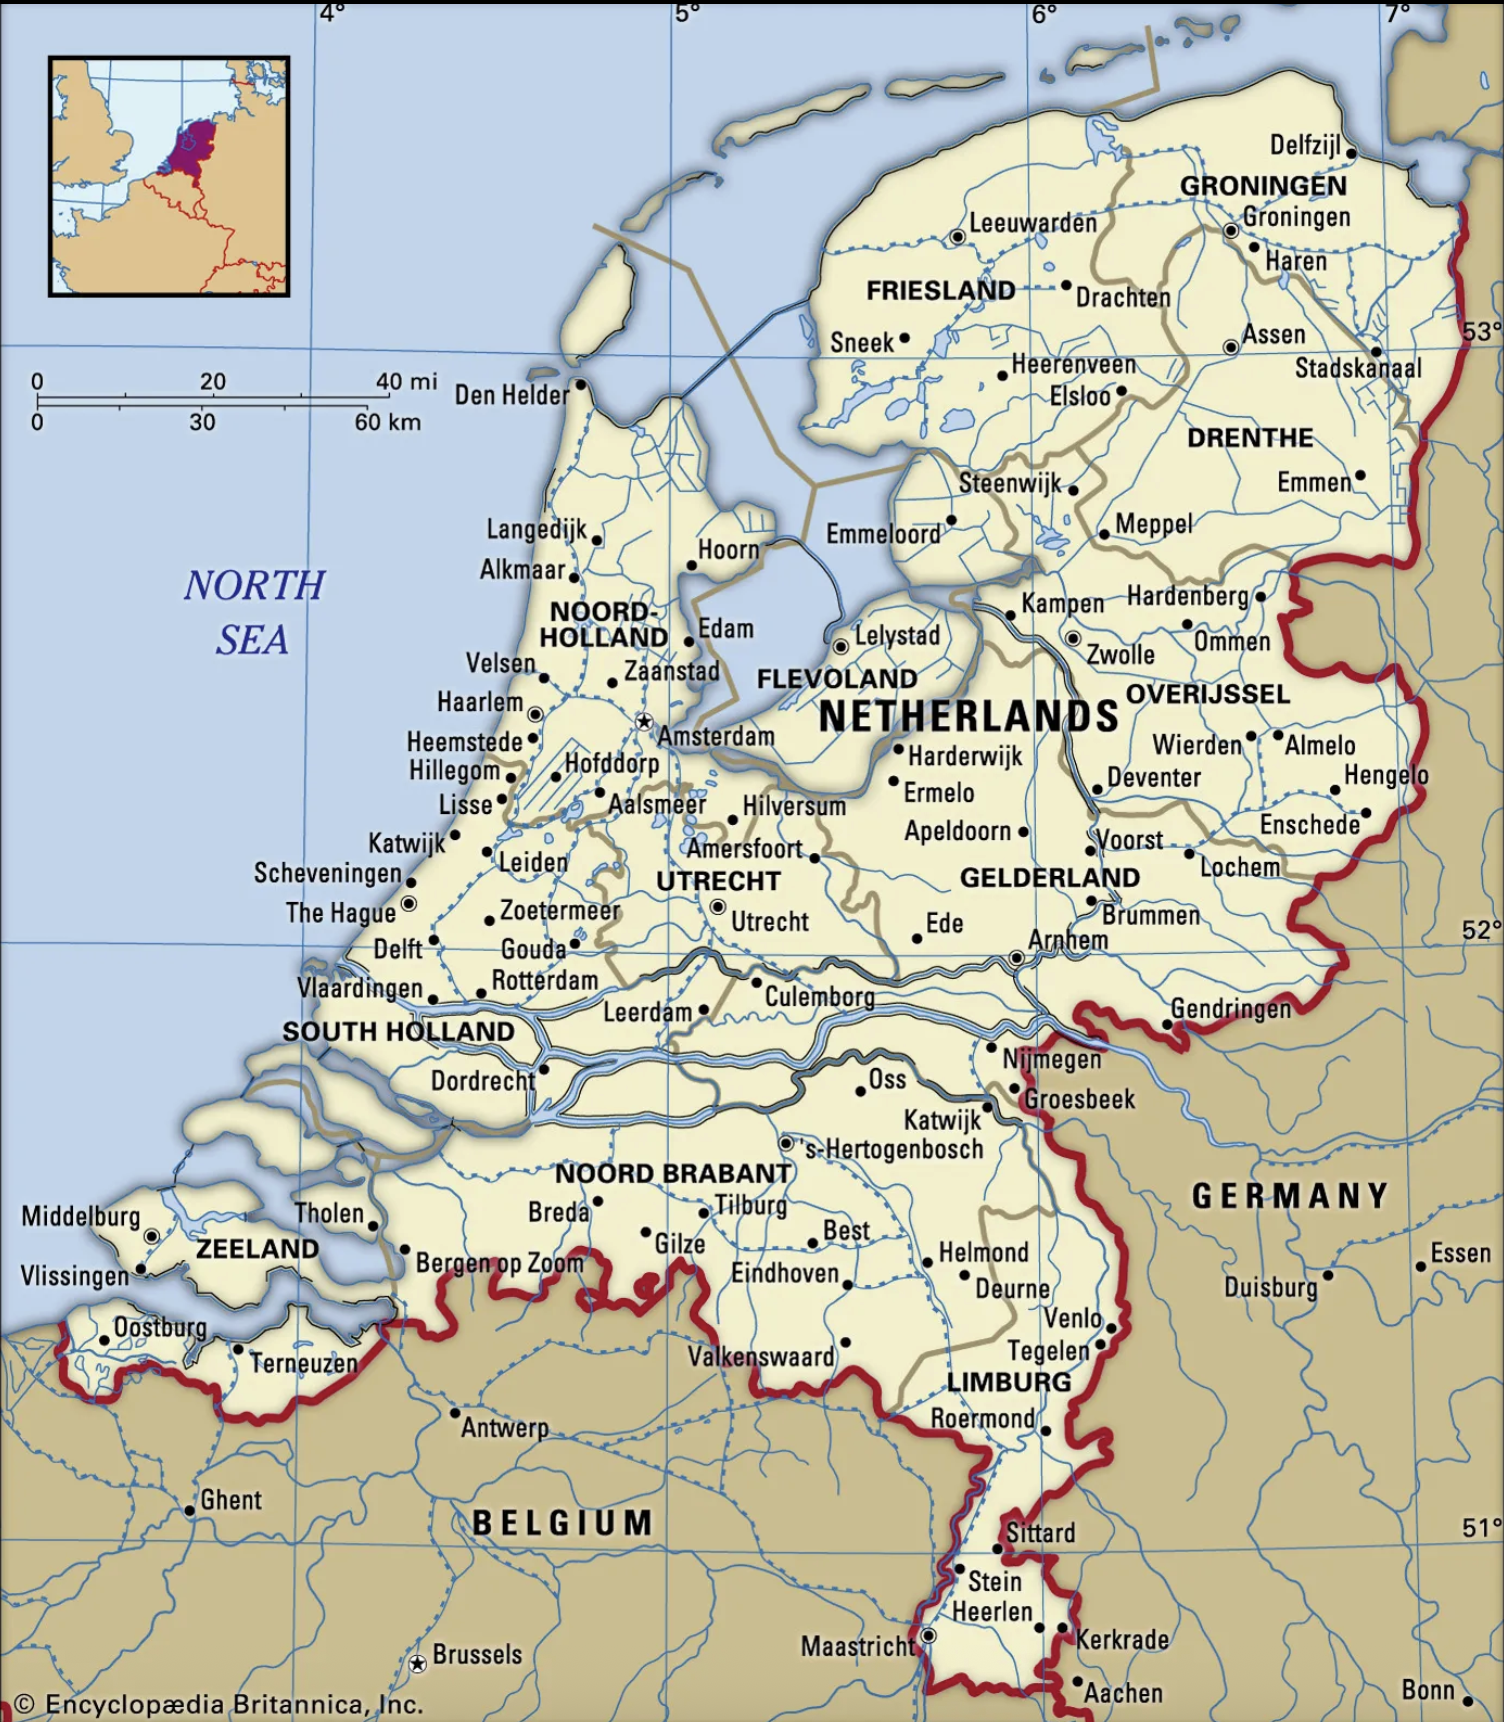 Netherlands map[1]. Source: Encyclopaedia Britannica, https://www.britannica.com/place/Netherlands
The Netherlands has few towns, cities that comes on the global ranking of Urban-Planned towns. This means, the towns would have higher living standard, with reasonable amount of trees, infrastructure. It also has proper space for bicycles and cars in the town.
The Netherlands, known for world class cycling infrastructure, Innovative water management, and people centric design. The Dutch are also known for decentralized design, purposefully avoid concentrating national wealth, government, and business in a single hub. The government sits in The Hague, while Amsterdam serves as the financial and cultural capital. They invented the woonerf, a residential street design where pedestrians, cyclists, and low-speed cars share the space equally without traditional curbs or traffic lights.
Houten
Houten is 14.5 kms from Utrecht, Netherlands. Utrecht, Netherlands has a population of about 378,140 people. Houten is considered one of the best designed towns in Netherlands. Some consider it as one of the best in the World. In Urban planning sphere, it was deliberately designed as Bicycle-friendly. The town’s whole structure makes cycling, walking, and train use easier than driving for daily local life. The Urban planning of Houten was designed by Dutch urban planner Robert Derks from the firm Wissing. Derks documented the planning process in his book “Het groen omarmd” (The Green Embraced).
The Houten-Model
Design Principles:
- The Inversion Theory - green and people first, cars last
- Ring Road System - a circular road system that minimizes through-traffic
- Central Spine - a green corridor running through the center of the town
- Strategic Car Access - cars reach homes but can’t cut through the town center
- 15-Minute City - ensuring all essential services are within a 15-minute walk or cycle
Houten’s revolutionary approach, known as “Inversie-stedenbouw” (inversion urbanism), fundamentally reversed traditional planning priorities. Instead of starting with roads and adding green space as an afterthought, Houten began with green infrastructure as the foundation.
Principles applied in Houten:
- Green First: The central green spine and network of parks were designed first as the structural backbone.
- Buildings Second: Residential and commercial buildings were then arranged to embrace and enhance these green spaces.
- Cars Last: Vehicle access was accommodated only after the pedestrian, cycling, and green networks were established.
- Continuous Green Network: Rather than isolated parks, Houten created an interconnected system of green corridors, waterways, and open spaces.
How is the Town Structured?
In conventional planning, the road network often comes first. Land is then divided into plots, buildings are constructed, and parks, footpaths, cycle lanes, drains, and public spaces are added later if there is space left. Levittown, New York in Long Island, is an example of this conventional approach.
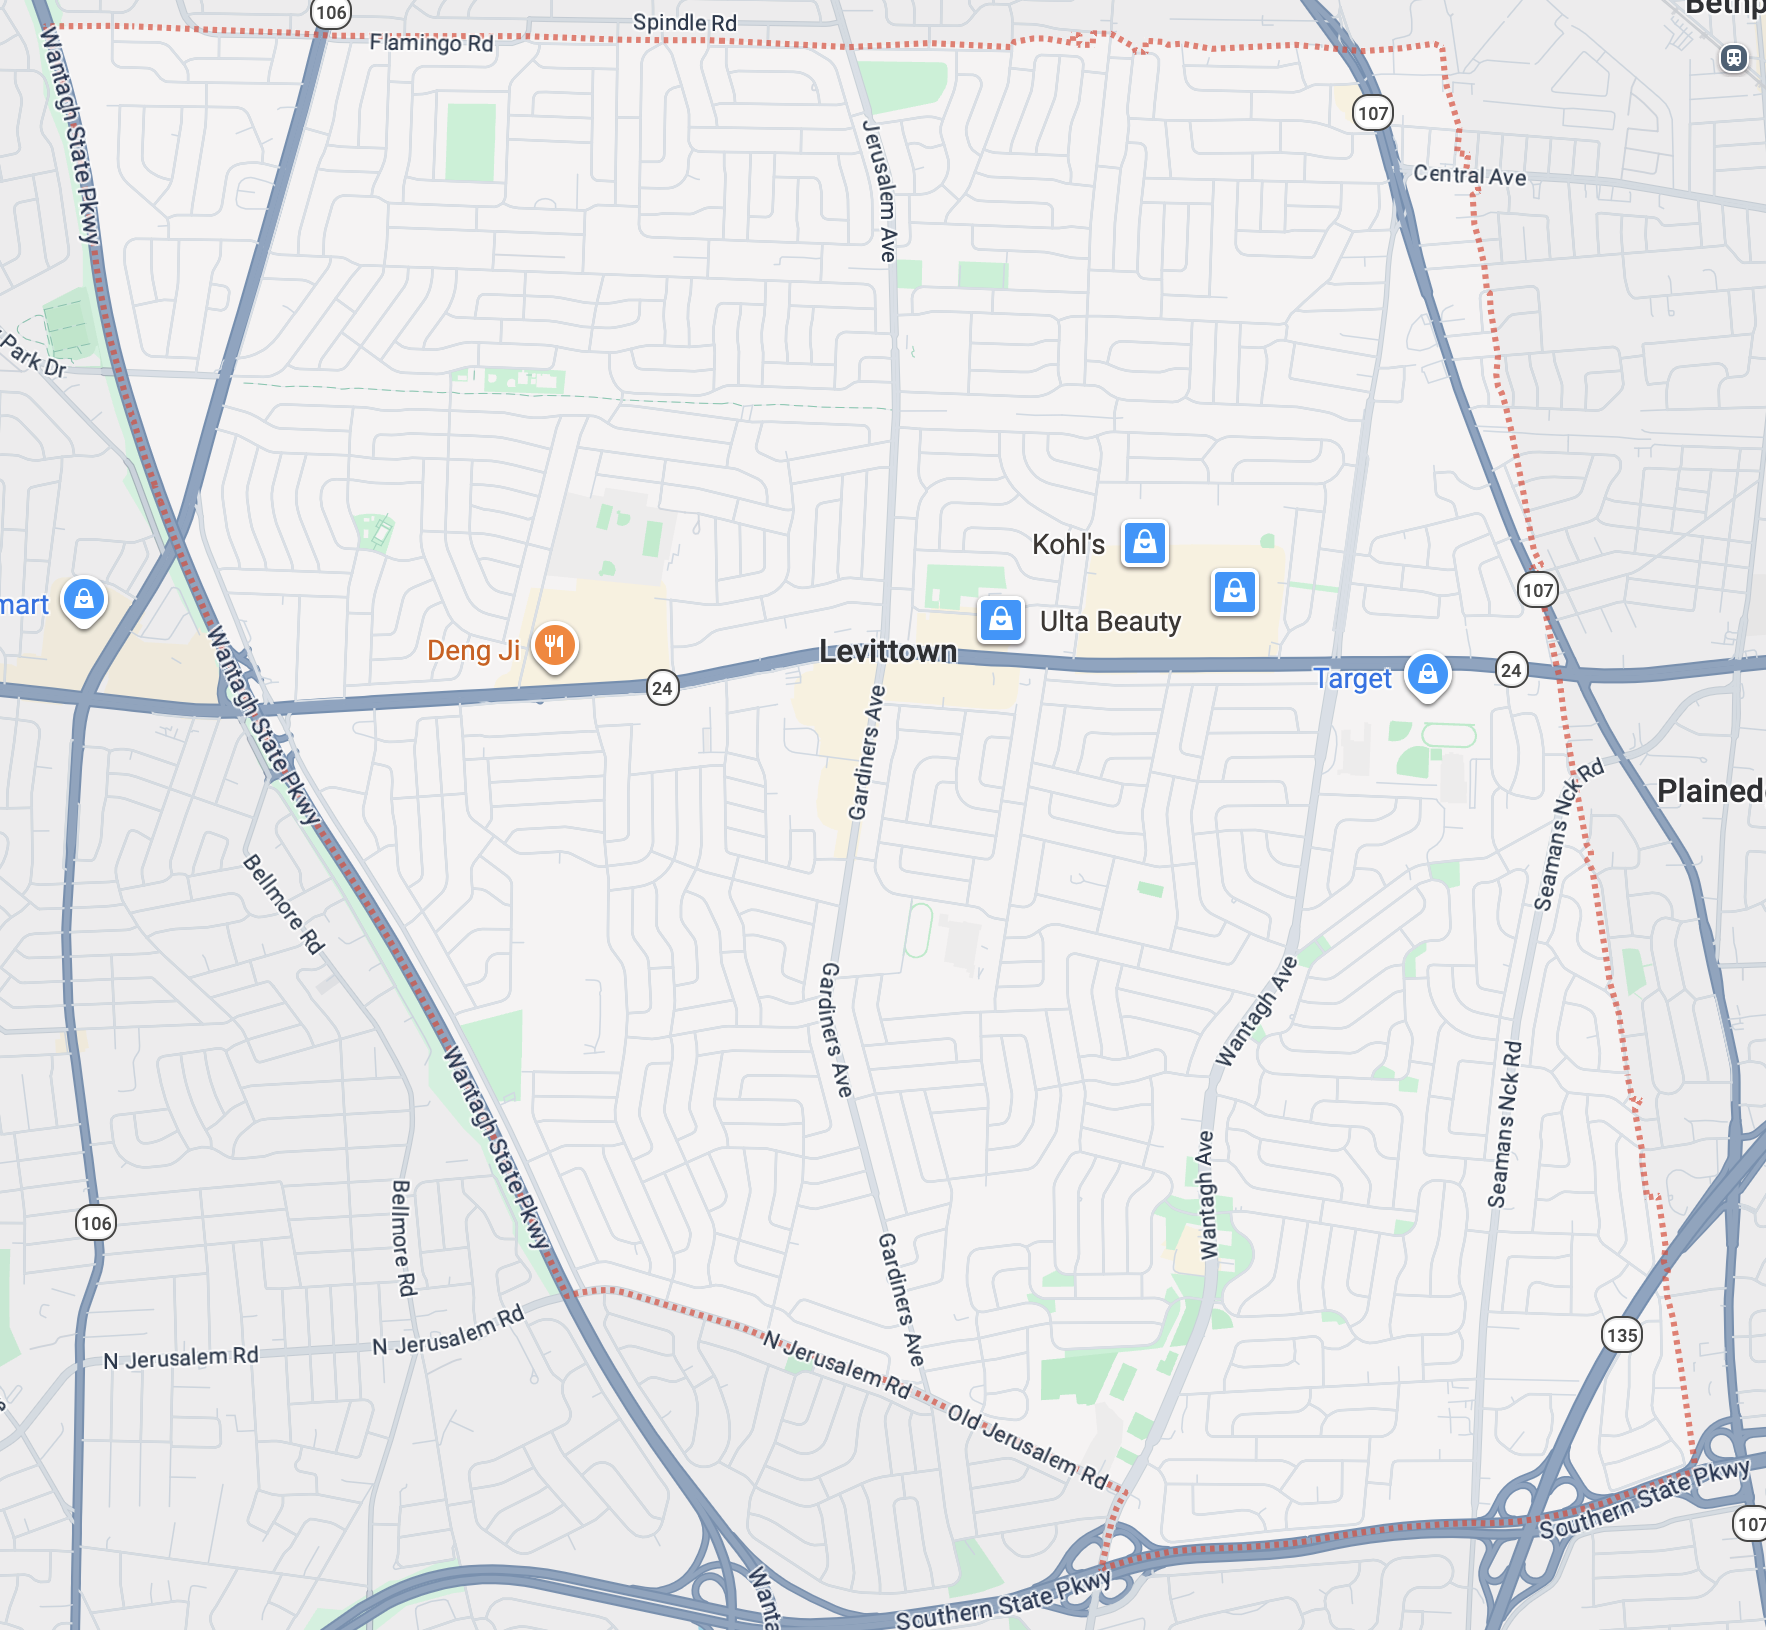
In conventional postwar planning, the development is built around the private car. Land is divided into plots, houses go up first, and the shared fabric, parks, footpaths, cycle lanes, public space is added later if room remains. Levittown, New York, on Long Island has 17,000 near-identical homes laid out for the automobile, with schools, shops, and parks following the houses rather than shaping them. Daily life there assumes a car for almost every trip.
Houten begins from the opposite assumption. Houten inverted this logic. Its planners began with the green structure, public space, walking routes, cycling routes, schools, and town center connections. Buildings were then placed around this framework. Cars were accommodated, but they were not allowed to dominate the local structure of the town.
Inversion Urbanism
Plan the slow, green, human network first then fit buildings around it, and let cars in last.
The basic principle is that the slowest and most vulnerable users, children, pedestrians, cyclists, elderly people, and local residents, should receive the most direct and protected routes. Cars should remain useful, but they should not be allowed to cut through every neighborhood or control the design of public space.
Ring Road System
The most famous part of Houten’s model is its ring road system. Instead of allowing cars to move directly through the town, Houten directs most car traffic to an outer ring road. From this ring road, cars enter residential neighborhoods through limited access points. This means a car can reach a house, but it usually cannot use the neighborhood as a shortcut. If a driver wants to go from one neighborhood to another, the route often requires going back to the ring road.
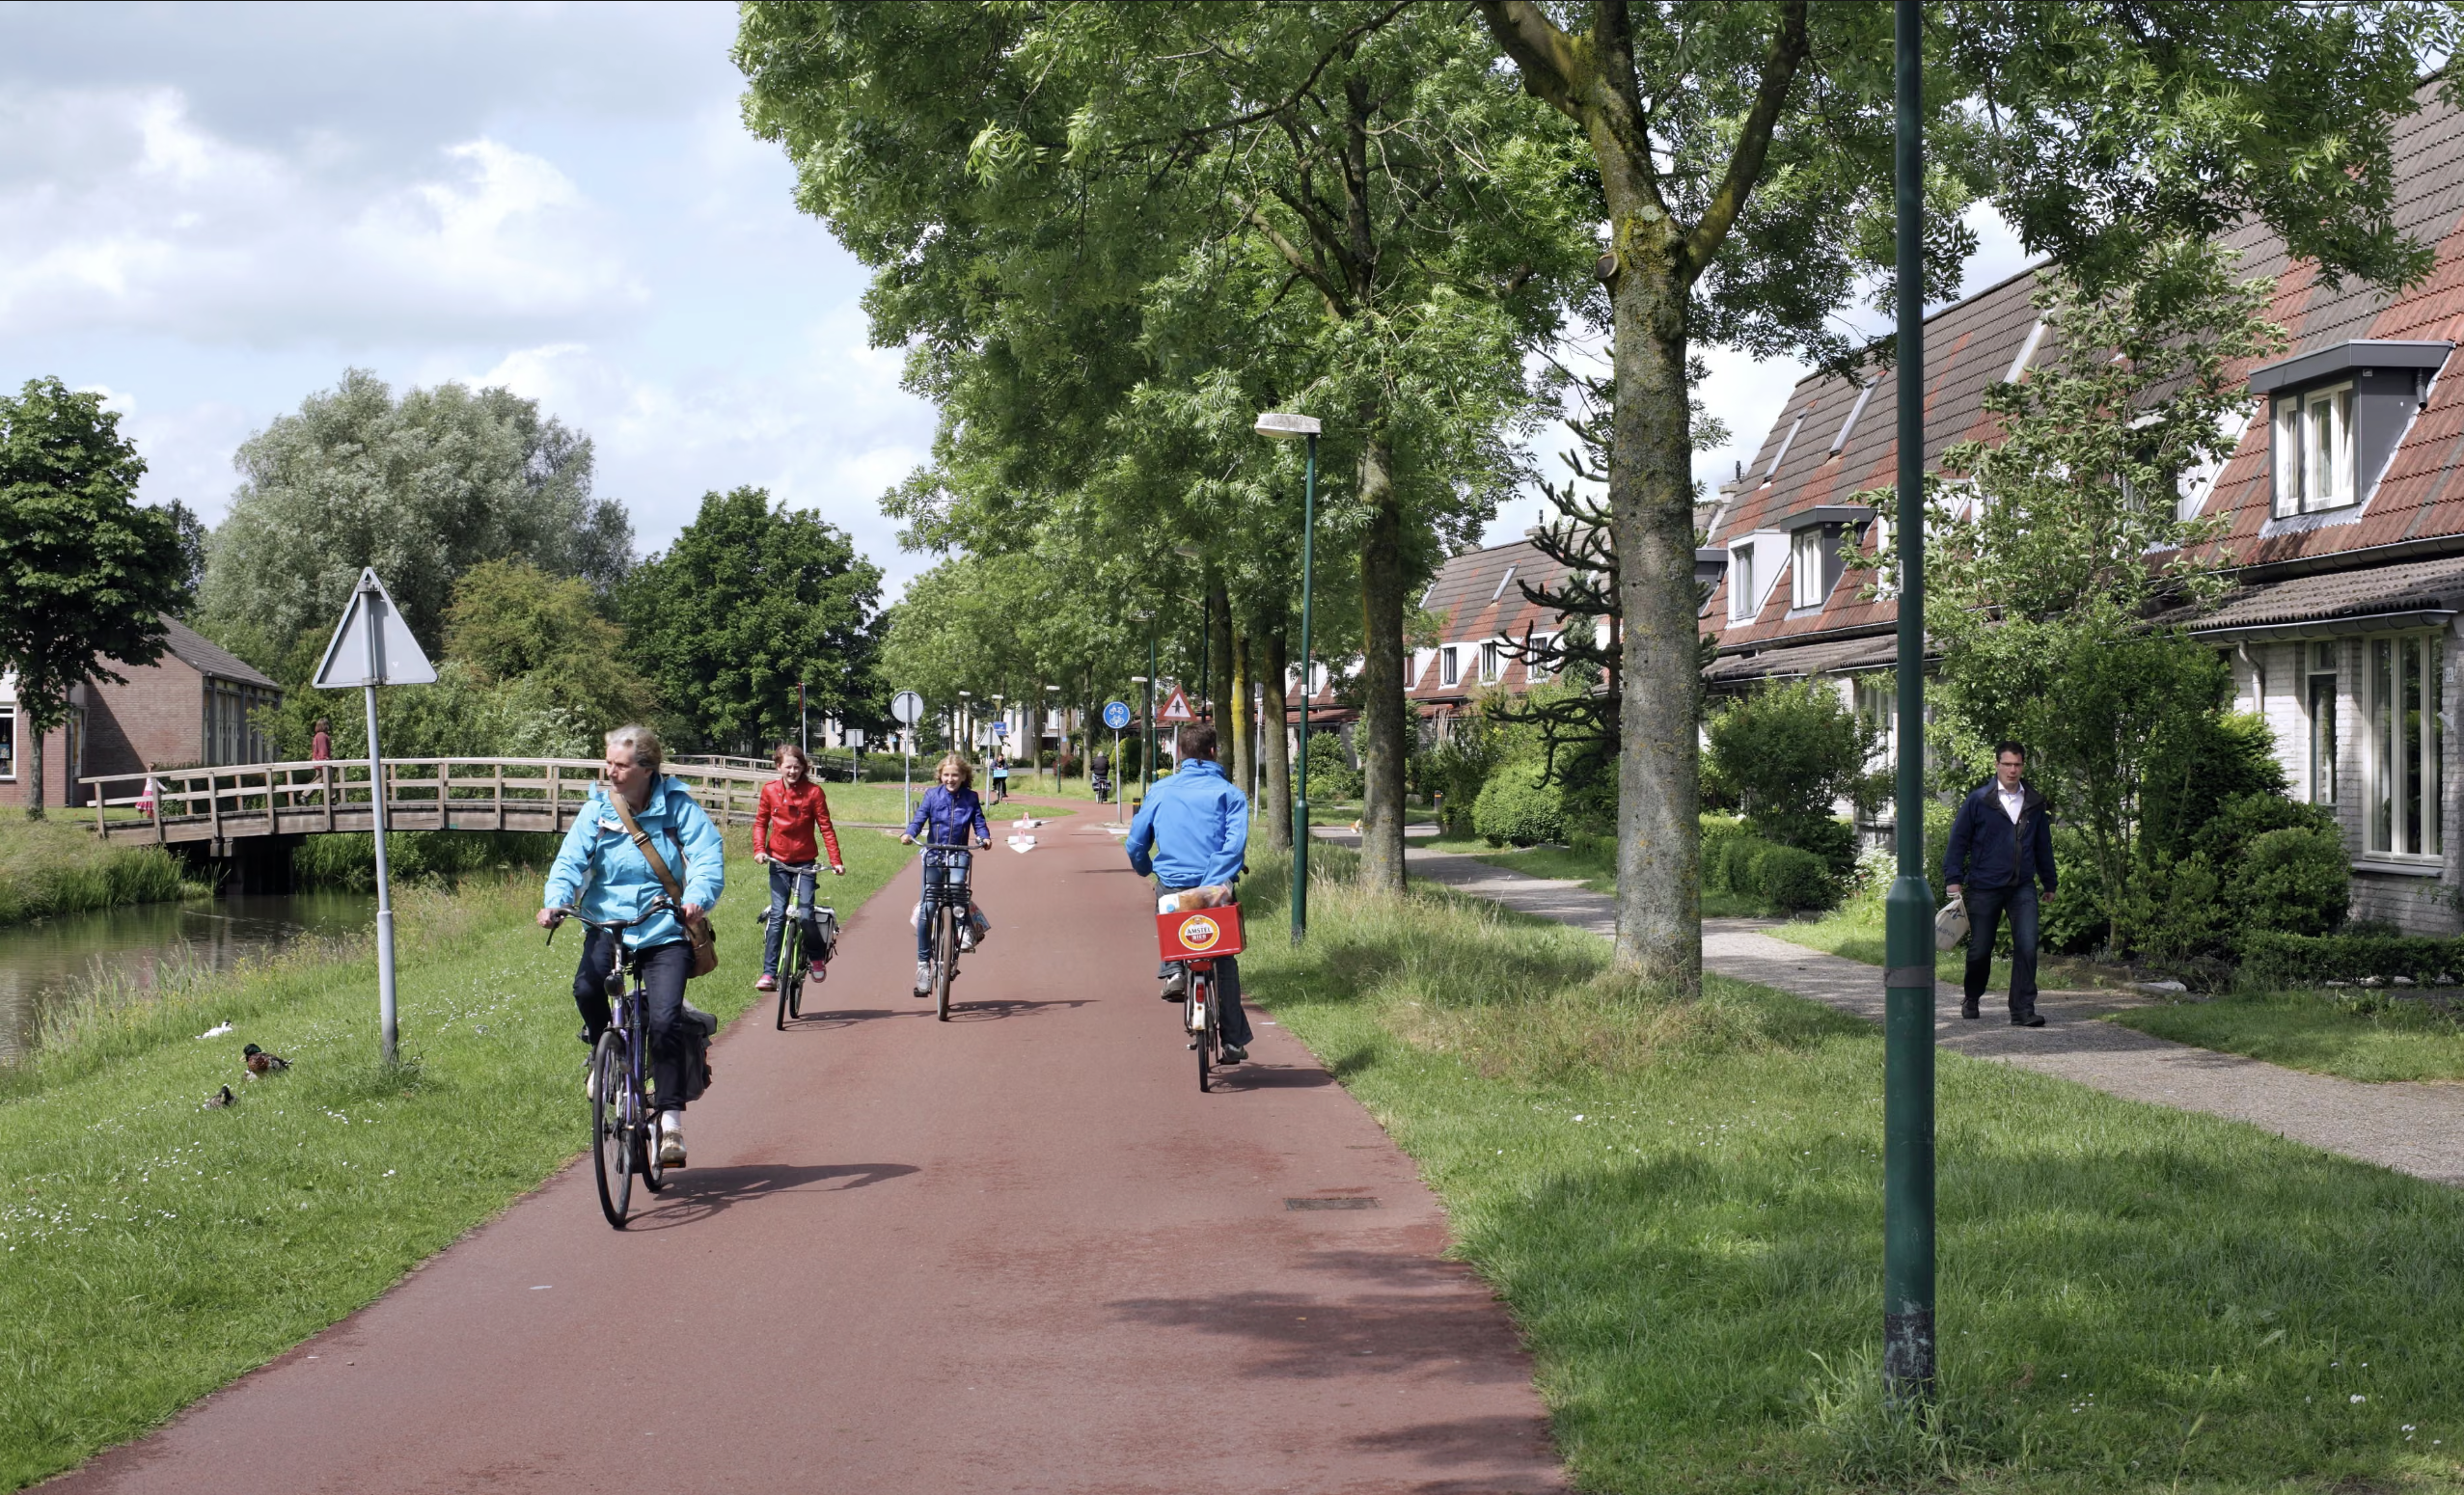
Cyclists and pedestrians experience the exact opposite. Where a car must detour out to the ring and back, a person on foot or on a bike moves straight through the town along a dense internal web of paths. This reversal has a name: filtered permeability, the network is deliberately “permeable” to walking and cycling while “filtering out” through-traffic by car. The walking and cycling routes are not just available; they are engineered to be shorter and more direct than the equivalent drive.
In Houten this is the organizing principle of the whole place. The payoff shows up for the people in the community, getting to school, the station, the shops, a park, a playground, or a friend’s house. For each of these, cycling is faster and convenient.
Filtered permeability
The diagrams earlier showed the principle: the bike goes straight through, the car detours out to the ring. This section is about the two questions a planner asks how is that actually built into the ground, and does it measurably work?
How the filter is physically built
“Filtered permeability”: leaving the walking-and-cycling network continuous while deliberately breaking the car network. In Houten, this includes:
- Modal filters: a bollard, gate, or planted break that a bike or pedestrian passes but a car cannot, placed where a street would otherwise become a through-route.
- Bicycle-permeable cul-de-sacs: streets that read as dead ends to a driver but connect onward for cycles, so the car network is a series of branches off the ring while the cycle network is a continuous web.
- Grade separation at the ring: underpasses and tunnels carry cyclists under the busy ring road and rail line, so the two networks cross without conflicting.
- Contraflow and short-cuts: one-way streets opened to two-way cycling, and cut-throughs where roads are closed to motor traffic, which shorten the bike trip relative to the drive.
The design philosophy behind this has a name in the Dutch literature, unbundling (ontvlechten): deliberately separating the car network from the cycle network rather than running both down the same streets. The filter is the unbundling made physical.
Rail Integration
The railway station is what keeps this local network from becoming a closed loop. Houten was conceived as a bicycle-and-rail town, and the two halves depend on each other: cycling solves the short distances inside the town, and rail solves the long ones beyond it. A resident can cycle a few minutes from home to the central station, leave the bike, and reach Utrecht shortly after; with connections, much of the Randstad becomes accessible without needing a car for the first leg. The later Houten Castellum station extended the same arrangement to the town’s southern growth. Without the railway, Houten’s compact, car-light design would risk leaving residents stranded; with it, the bicycle becomes the first leg of a regional journey rather than a constraint on one.
Green-Blue Network
The town’s green structure does the quiet work that makes all of this hold together. Houten is organized around a continuous system of green corridors, parks, water features, play spaces, and landscape routes, and these are not the decorative offcuts left over once the buildings are placed. They are the skeleton the town is built on. The same green corridors that give children somewhere to play are the ones that carry the cycle paths; the same waterways that manage drainage also shape where neighborhoods begin and end.
Because the green network and the movement network are one and the same, a calm, planted environment isn’t a luxury added on top of mobility, it is the mobility. This is why Houten reads as more livable and community-minded than a conventional suburb: green space, movement, and everyday life were never separate systems competing for the same ground. They were designed as one.
The green-blue network performs multiple functions at once:
- it gives residents access to recreation and nature
- it carries walking and cycling routes
- it shapes neighborhood identity
- it supports drainage and water management
- it cools the urban environment
- it creates safe routes for children and elderly residents
- it prevents the town from becoming a continuous mass of asphalt and buildings
For professionals, this is a case of multi-functional infrastructure. The same corridor can support mobility, stormwater, ecology, recreation, and social life. This is especially relevant for Indian cities facing heat, flooding, and public-space shortages. A drainage channel should not be treated only as an engineering trench. A park should not be treated only as decoration. A shaded pedestrian path should not be treated as optional. These systems can be designed together.
Hierarchy of Movement
Houten also works because it has a clear hierarchy of movement. Fast and heavy traffic belongs on the outer road. Local car access belongs inside neighborhoods but at low speeds and limited volumes. Cycling and walking receive direct routes through the center. Rail connects the town to the region. Green corridors and public spaces link daily destinations. This hierarchy prevents all forms of movement from fighting for the same street space.
Houten’s strength is integration: land use, cycling, walking, rail, green space, schools, neighborhood design, traffic filtering, and long-term maintenance are treated as one system. Cycling became the natural daily choice because the whole town was arranged to make it direct, safe, and useful.
Houten’s operational and long term success also depended on continuity. The design principles were protected and extended over decades. Later phases of Houten continued the same underlying logic: green-first planning, cycle priority, controlled car access, and neighborhood structure. This long-term design discipline is one of the main reasons why Houten succeeded.
Transportation: Bicycle network Houten
The cycling network is treated like a public utility, continuous, legible, maintained, connected to schools and stations, and protected from heavy traffic. For civil engineers, the important question is how it is built: width, surface, buffer, gradient, crossing treatment, drainage, lighting, and maintenance access.
A civil engineer thinks in section: how wide, how high, what gradient, what surface, what clearance, what drainage, and what maintenance access? Those details matter. Houten’s cycling infrastructure broadly follows the Dutch CROW design[2] logic: directness, safety, comfort, coherence, and attractiveness.
Cycle path cross-sections
| Facility | CROW width | When used |
|---|---|---|
| One-way cycle track | 2.0 m min · 2.5 m desirable | branches off the main network |
| Two-way cycle track (solitary) | 3.0 m min · 3.5–4.0 m standard | Houten’s red through-routes |
| By volume (one-way) | 2.0 m ≤150/hr · 3.0 m 150–750/hr · 4.0 m >750/hr | sized to demand, not guessed |
| Local pinch points | down to 1.5 m | only briefly, e.g. at a constrained crossing |
The defining detail is the separation beside it. A Dutch cycle track (as opposed to a painted lane) is physically divided from the carriageway by a verge, raised kerb, or planted strip, typically 1.5–2.0 m of buffer. This is the ontvlechten (unbundling) principle made concrete: the car network and the cycle network do not share a surface. The tracks themselves are machine laid red asphalt a continuous, smooth, low-rolling-resistance surface that stays usable in rain and winter, with the red colour doing the legibility work so the network reads as one object across the whole town.
Crossing the ring and the rail: Grade separation
Where the cycle network meets the ring road or the railway, Houten does not negotiate the conflict with signals: it removes it, by carrying cyclists under the barrier in an underpass or over it on a bridge. The governing standard here is not width but social safety (sociale veiligheid): a tunnel a cyclist is afraid to use at night has failed, however structurally sound. The CROW[2] rules of thumb as built in Houten:
- Vertical clearance: a minimum of about 2.5 m, often 2.5–3.0 m, so the space feels open rather than a culvert.
- Sightline through: the underpass is straight and short enough that you can see daylight at the far end before you enter it; no blind corners, no hidden recesses.
- Width and light: generous width (wider than the path it carries), bright even lighting, and where possible a partly open top or rooflight so daytime use needs no lamps.
- Gradient: ramps kept gentle for comfort and for less-able cyclists, in the order of 1:20–1:25 on the longer approaches, steeper only over short rises.
- Drainage: because the underpass dips below grade it is the low point of the local surface, so it needs a sump with a pump or a generously sized infiltration drain; a flooded tunnel is the most common failure mode of this detail.
At the key internal ring connection, Houten goes further still, with a multi-level, segregated road-and-cycle roundabout : cars and bikes resolved onto different planes entirely. At at-grade points the standard Dutch treatment applies: a continuous annular cycle track set back ~5 m from the circulatory carriageway (so a car clears the crossing without blocking a cyclist), with cyclists given priority on urban roundabouts.
Transportation: Car usage in Houten
Houtenaars own plenty of cars. The measured mode split for journeys within Houten is striking, cycling around 34%, walking 14%, public transport 5% and the private car still about 46%. For short trips under 7.5 km the bike does much better (cycling ~48%, car ~29%), and for trips to the town centre cycling reaches ~61%. But the town has not abolished the car, it has demoted it for local trips while leaving it available for everything else.
The limit of the model, stated plainly
Houten is a micro-scale solution. It brilliantly solves the short, internal, everyday trip, school, shop, station, friend’s house, and pushes those onto the bike. It does not solve the longer regional and commuter journeys, which is why the car still takes ~46% of internal trips and car ownership remains high.
Schools, Children, Supermarket and Mobility
One of Houten’s strongest achievements is the placement of schools and daily destinations along the slow-mobility network. This gives children a degree of independence that is rare in car-dominated suburbs. In many towns, children depend on parents for every trip because the street network is unsafe. This creates traffic congestion near schools, wastes family time, increases pollution, and reduces children’s freedom.
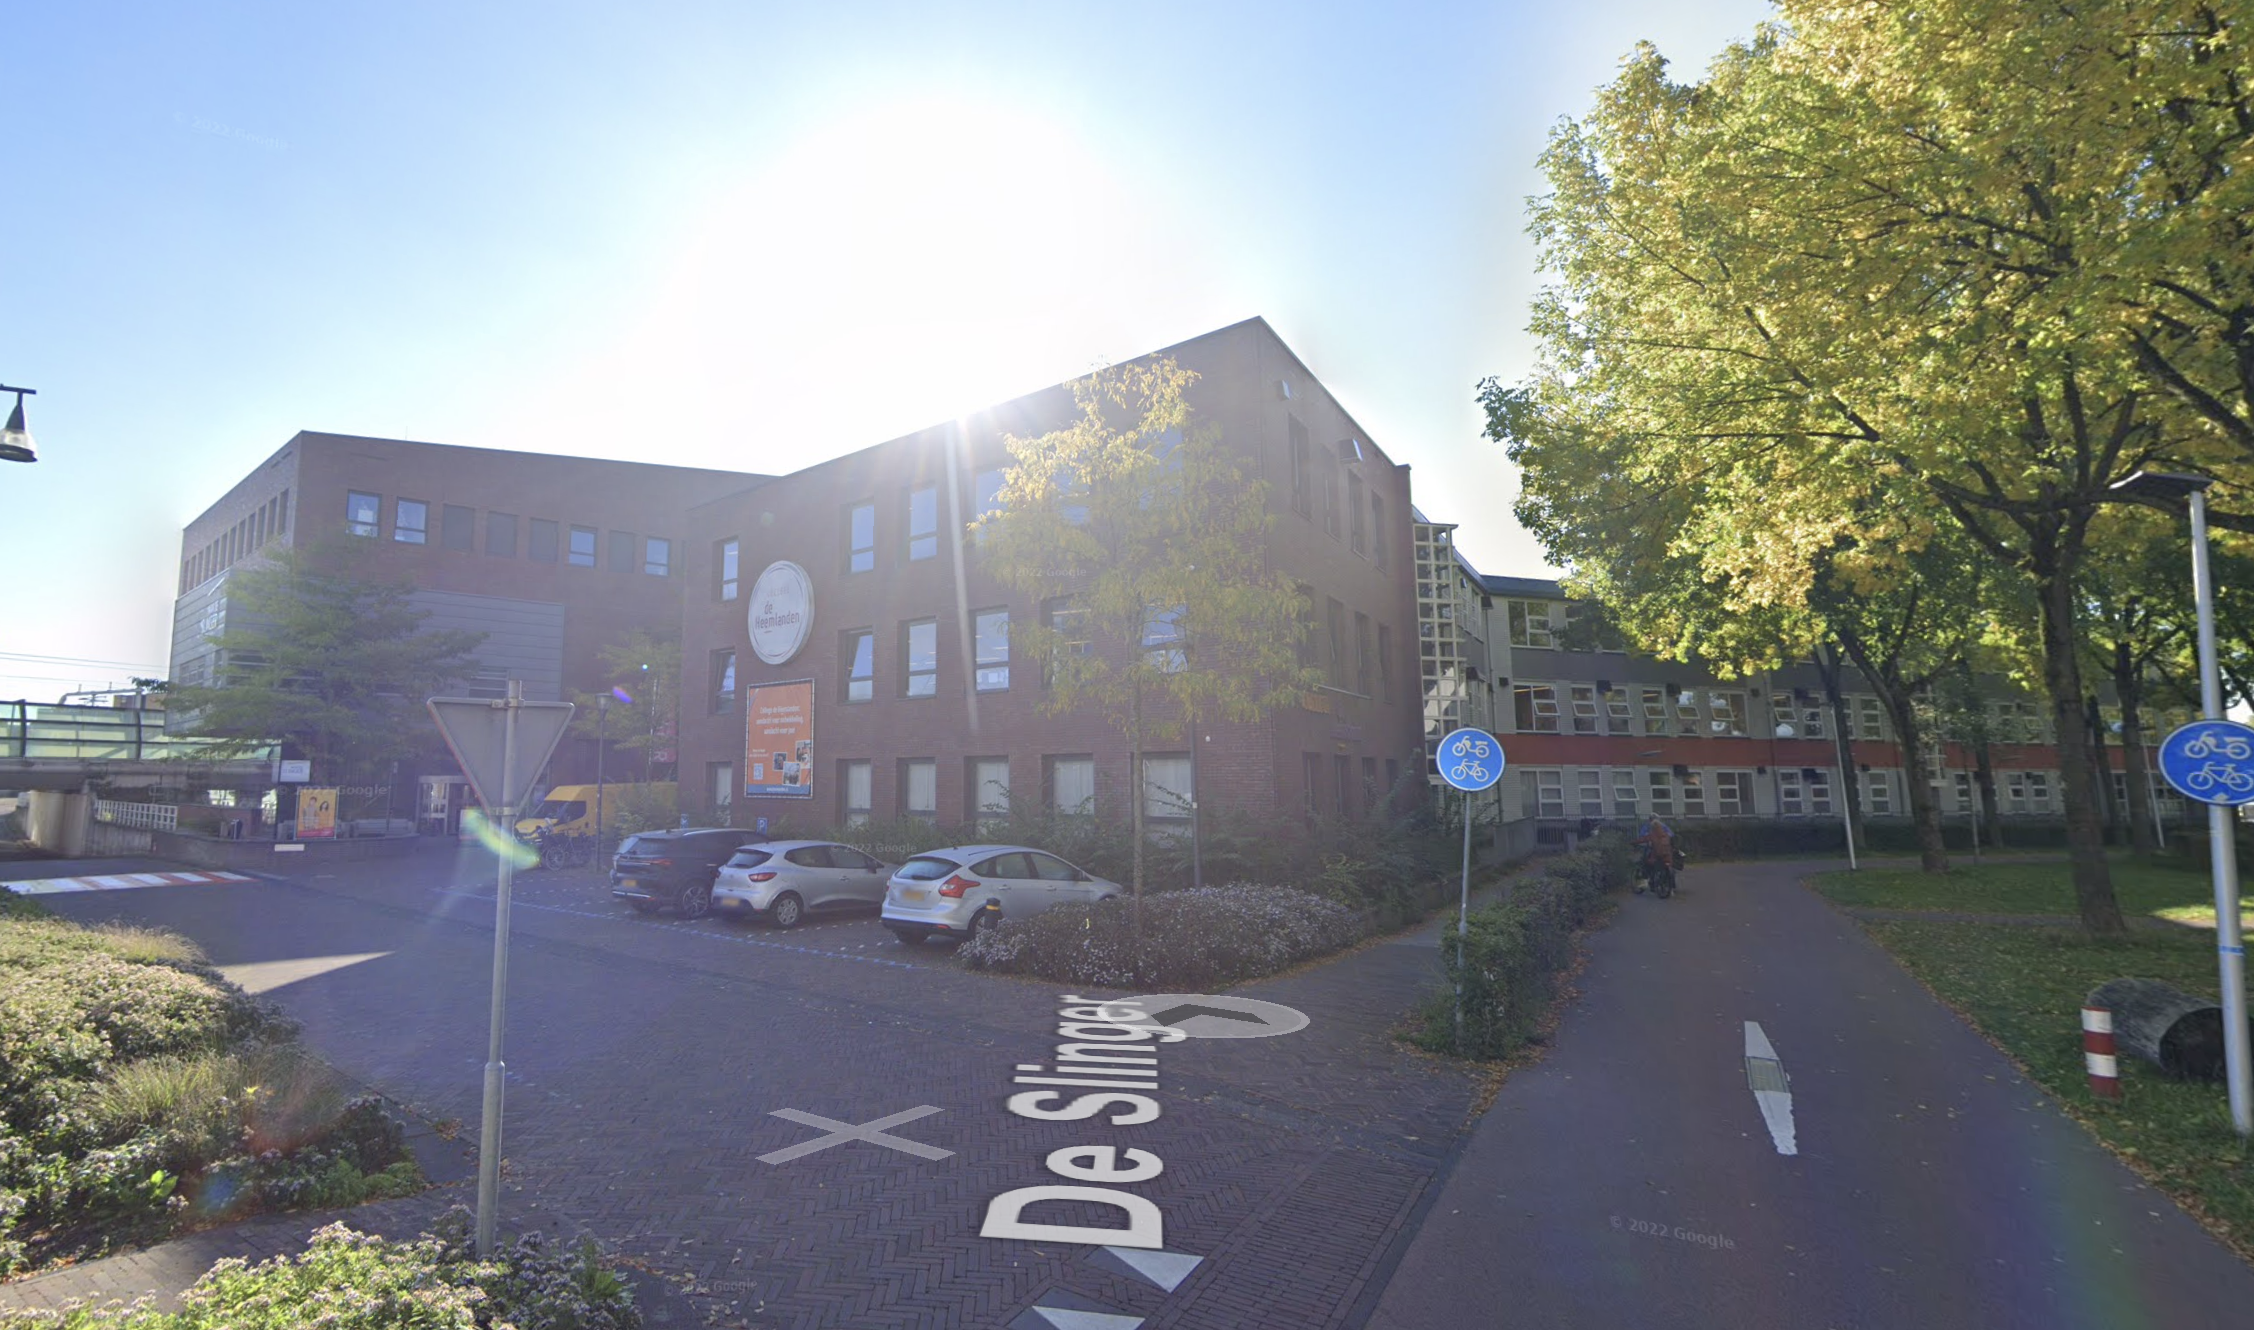
Houten shows another possibility, if schools are directly connected to safe cycling and walking routes, children can move more independently. All vital urban functions, including schools, are located directly at the main cycle network. Bicycle routes to schools are direct, smooth, and high-quality. Asphalt surfaces, Red-colored, recognizable paths, No traffic lights on main routes, ensuring flowing cycle traffic without delays.
At intersections with car roads, bicycle traffic flows through tunnels or bridges, keeping cyclists separate from cars.
Because schools are on the protected bike network and only ~1.6 km away, 99% of children go to school by bike or other active modes, and many cycle independently from a young age. Average cycling distance to the nearest primary school is less than 0.6 km. And 18% of Houten residents live ≤500 m from a grocery store. 50% live <1 km from a grocery store. The average is 1.2 km.
A truly well-planned town lets children move safely on their own, without every trip to school becoming a family transport operation.
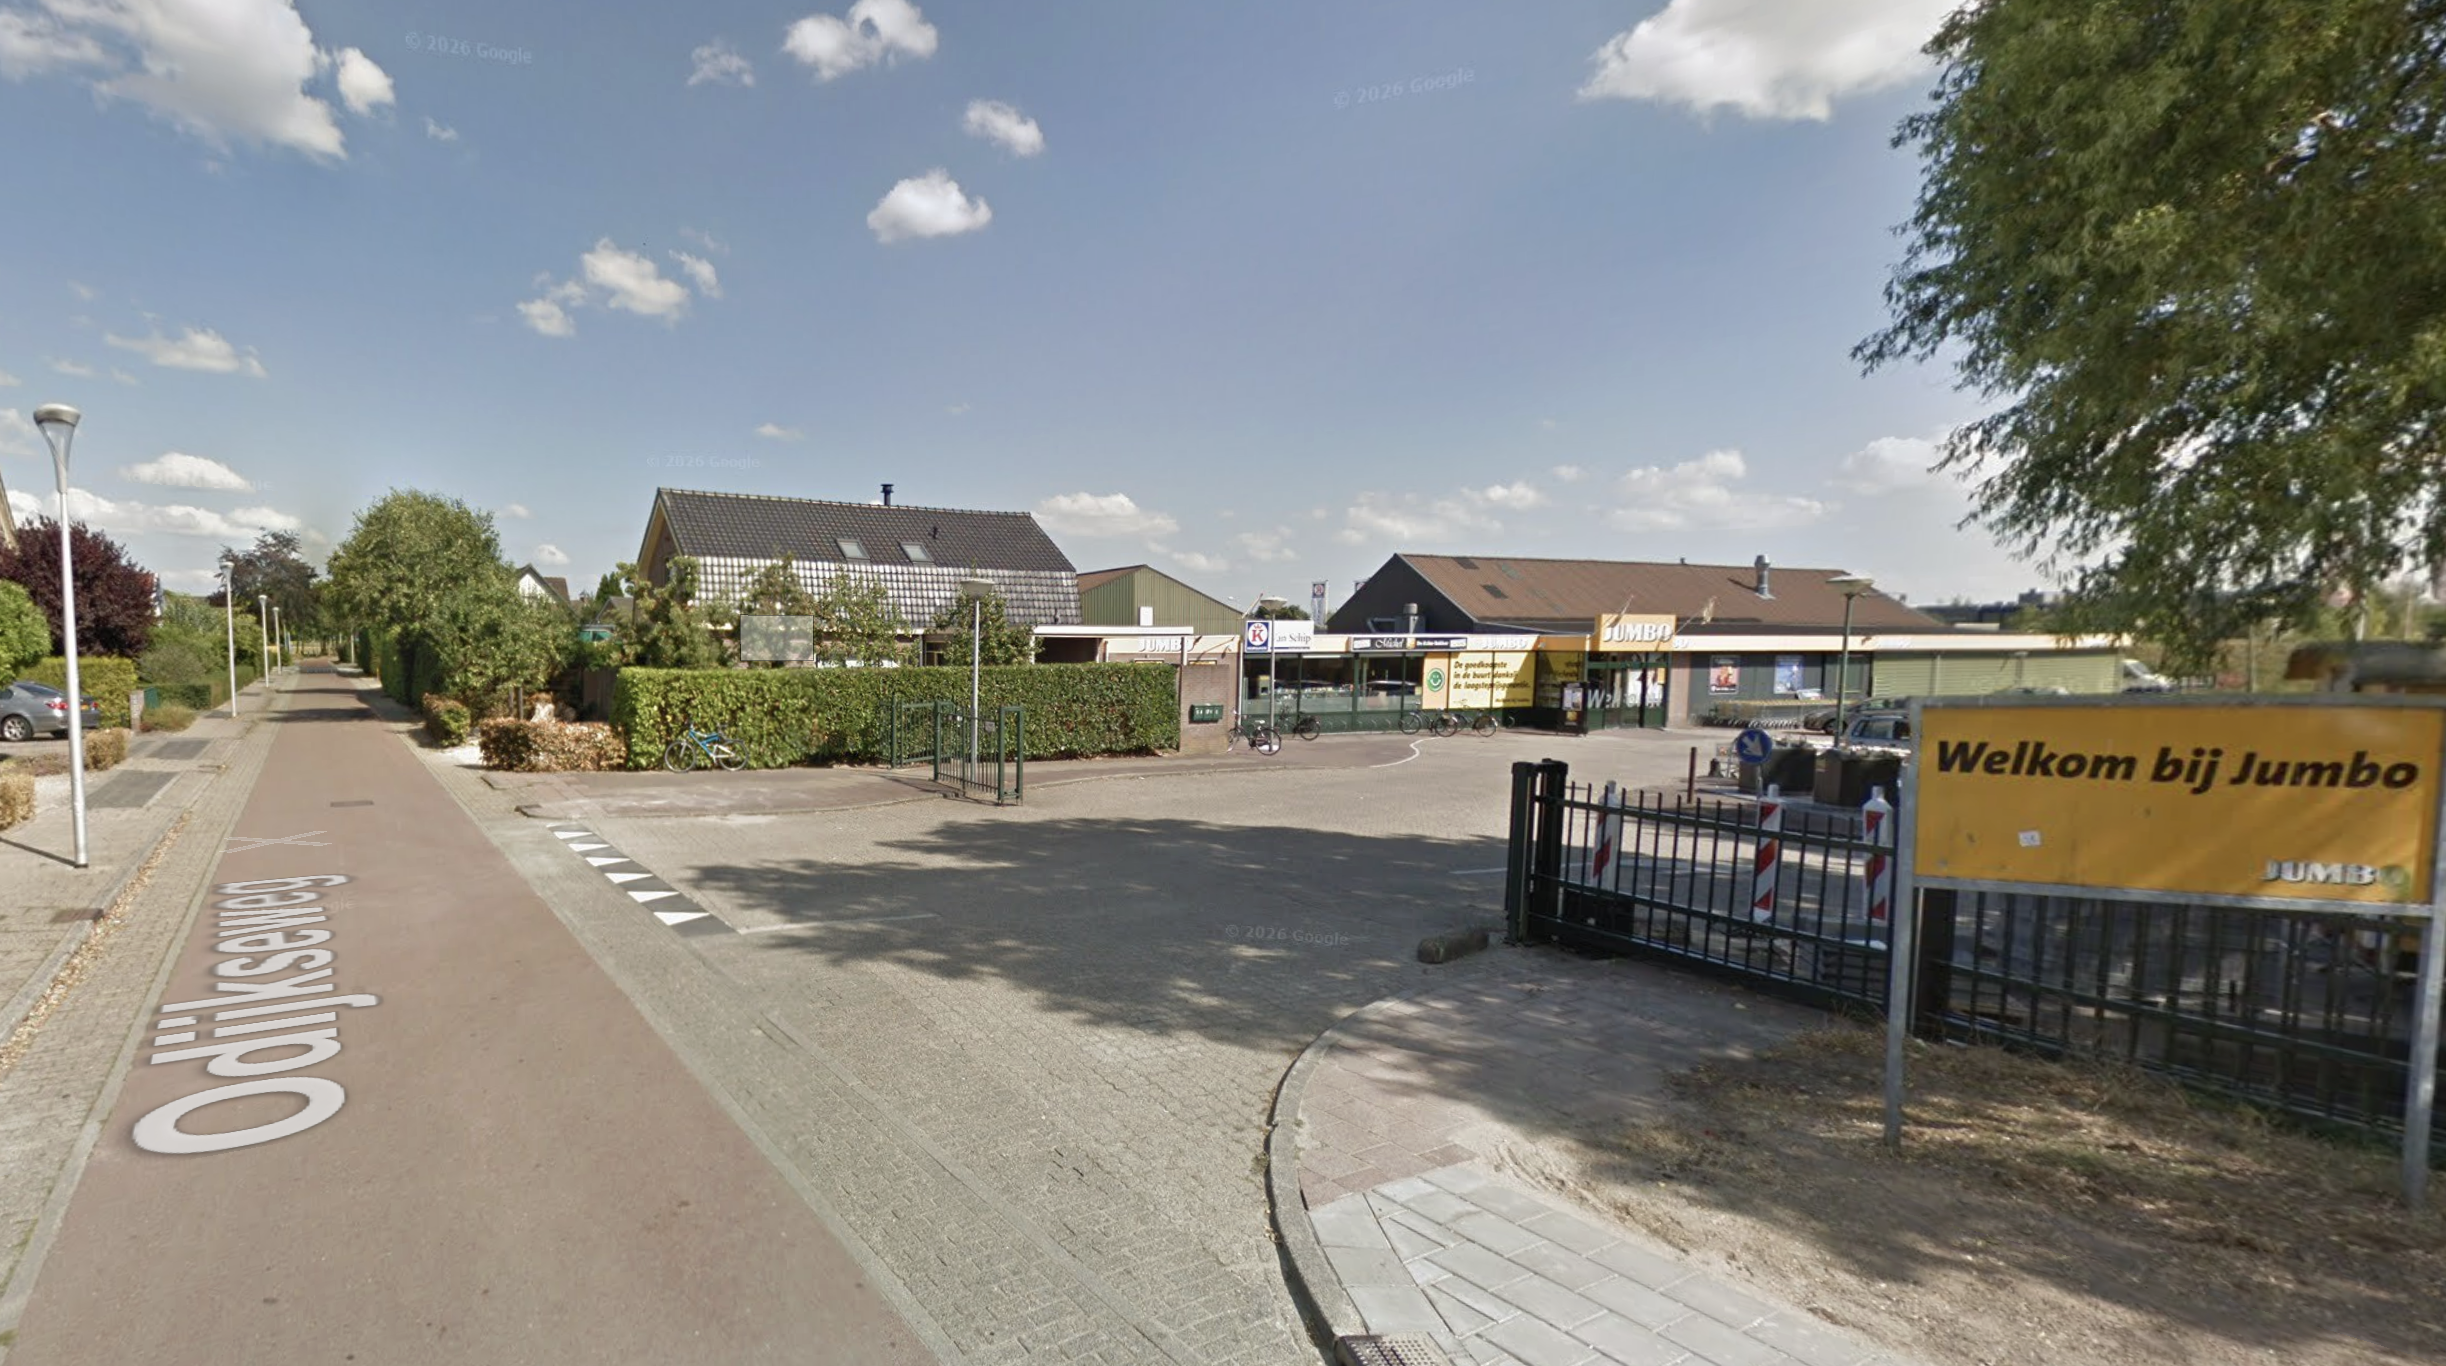
Houten is well-served by Dutch grocery chains, with 18% of residents living ≤500 m from a grocery store and 50% within 1 km The Houten weekly market runs every Thursday from 08:00 to 14:00 at the central Winkelcentrum ’t Rond. It’s the perfect place to shop for fresh, local produce, cheeses, baked goods, and household items right in the heart of the city.
In this picture, Jumbo, an international supermarket chain is visible, notice the infrastructure, designated zoning for cycling. On the right side, there is Jumbo with a dedicated parking lot for car users.
The town also has dedicated, Cafe and active nightlife areas, cultural center for events and activities, Nieuwegeinse Golfclub (Golf-area) and Churches for religious worship areas.
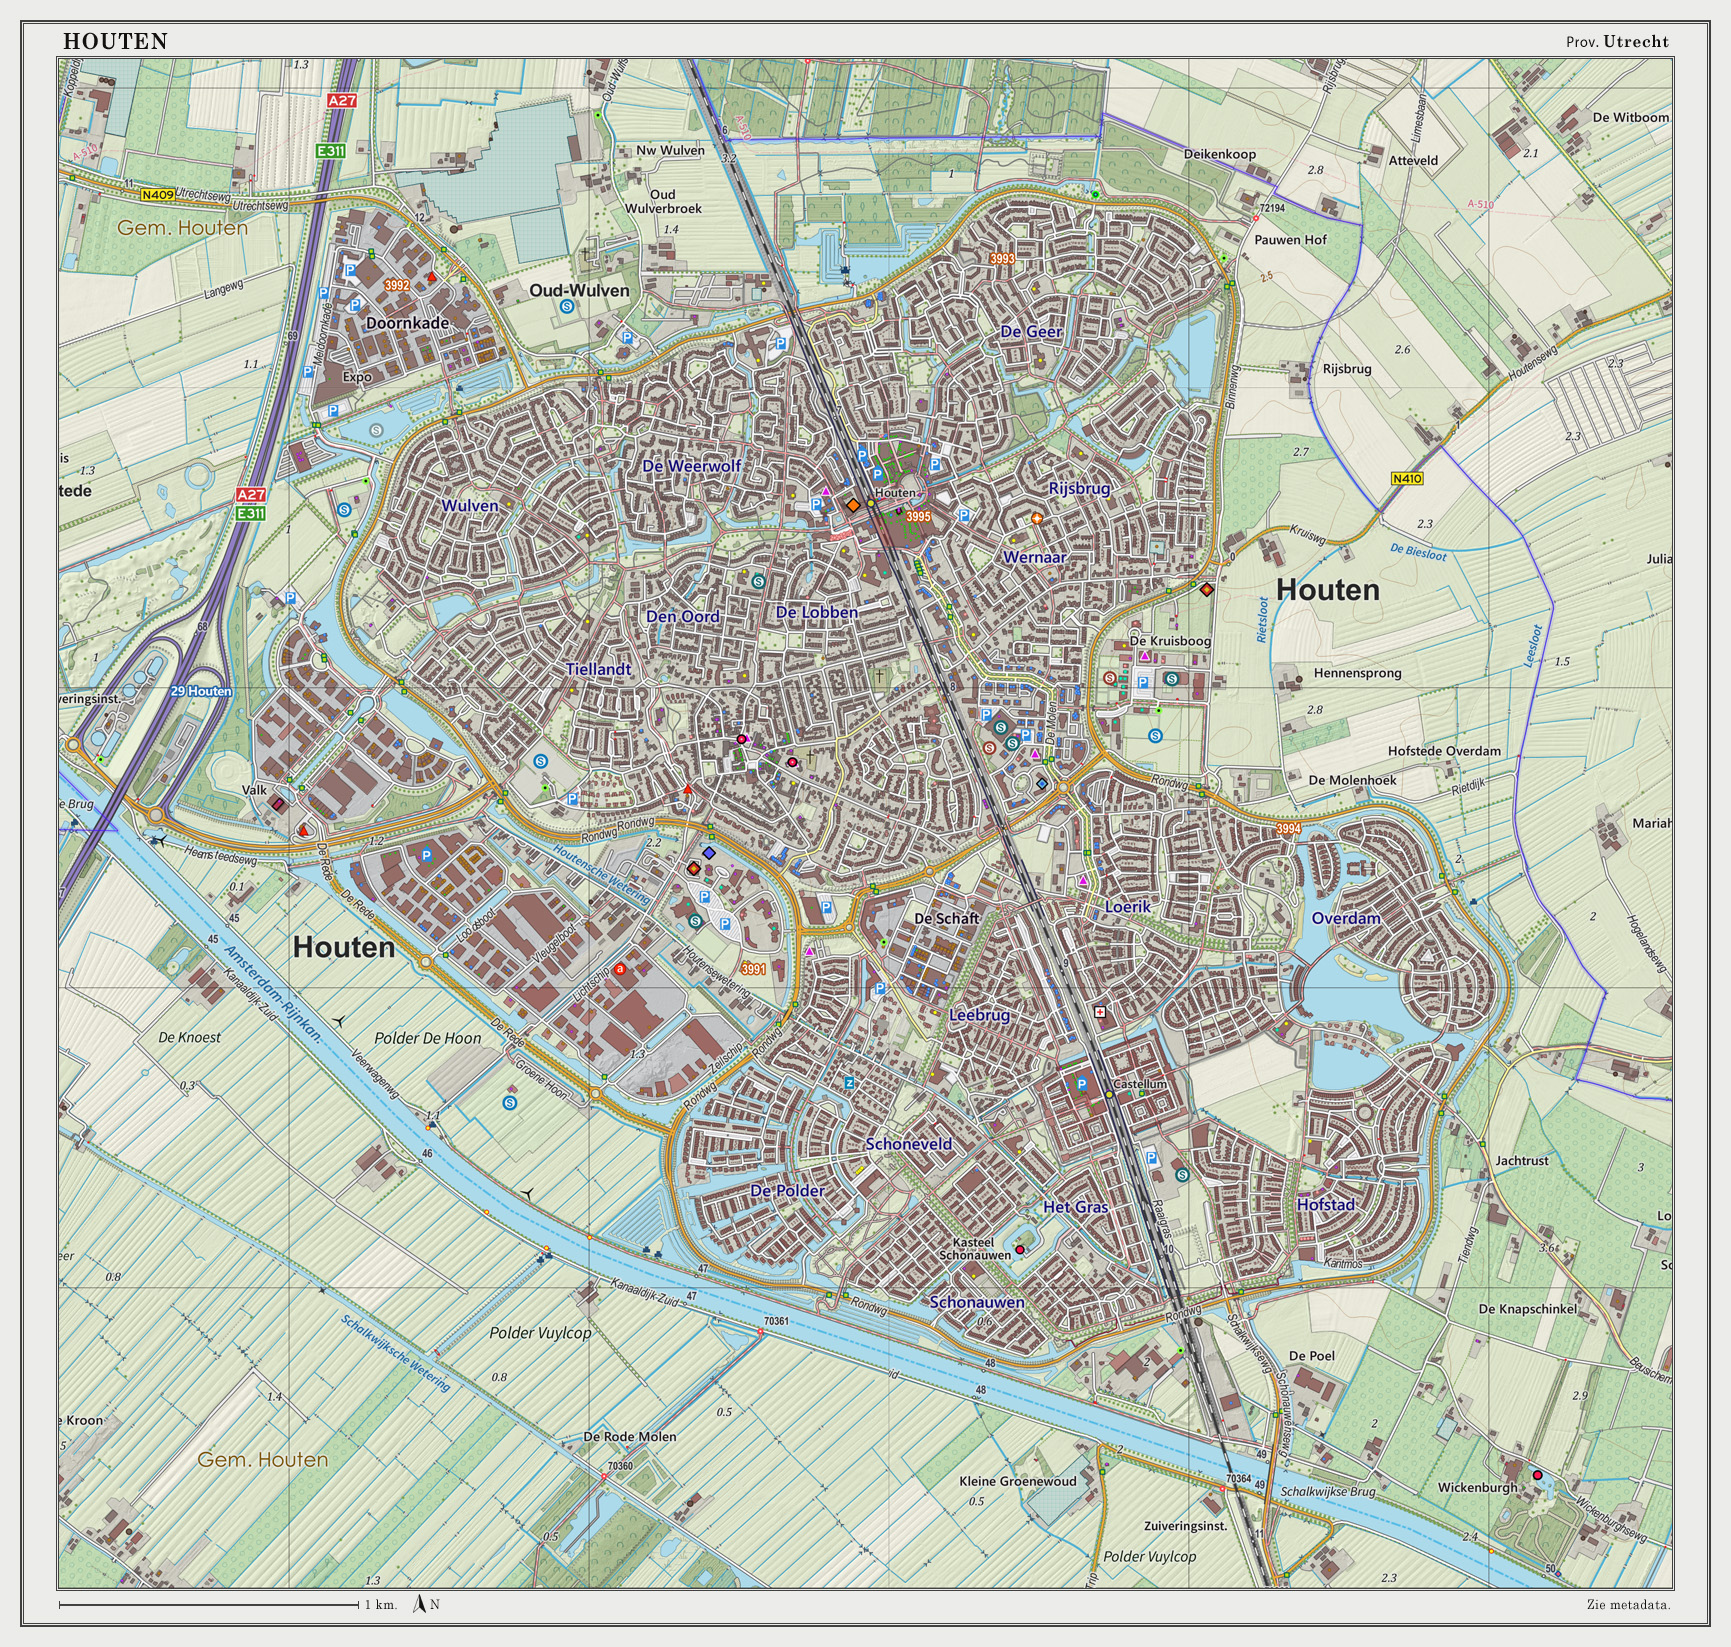
Houten’s Network, Layer by Layer
Houten is not a single-use bedroom suburb. It combines housing, schools, shops, railway stations, public services, parks, sports fields, water corridors, and local employment areas within a compact town structure. The town center and station area carry the higher-intensity civic and commercial functions. Residential neighborhoods are placed around green corridors and cycle routes. Schools and sports facilities sit close to the cycling network. Larger car-oriented access is pushed outward toward the ring road. This creates a hierarchy: quiet residential life inside, regional movement by rail, car circulation at the edge, and daily services placed where walking and cycling can reach them.
Map data: OpenStreetMap[3] contributors. Visualization by Rick Rejeleene, after the Houten street-network map idea shown by Langley Urbanist Society.
Land Use and the Zoning Mechanism
A diagram of green corridors explains the shape of Houten. It does not explain why forty years later, a developer cannot simply buy a plot beside the central spine and put a drive-through and a car park on it. It is a legal instrument that binds every square metre of the town to a permitted use, and it is the single most under-appreciated reason the inversion model survived into its second generation.
The original brief deliberately mixed uses so that daily needs sit inside the cycling network rather than out on the ring. In broad terms the built land breaks down roughly as follows, useful as a planning order of magnitude rather than a cadastral fact:
| Land use | Share of built area (approx.) | What it includes |
|---|---|---|
| Residential | ~55–60% | Low-rise houses and modest apartments, ~50,000 residents |
| Green & blue / public space | ~20% | The spine, parks, water, sports fields, play areas |
| Roads, cycle tracks, parking | ~10% | Ring, internal streets, the red cycle web, station transferia |
| Centres & retail | ~5% | Two station-side centres (Houten Centrum, Castellum) |
| Employment / civic / schools | ~8–10% | Schools, offices, sports halls, cultural and care buildings |
The structurally important number is the last three rows together: shops, schools, jobs and civic buildings are placed beside the two railway stations and along the slow network, not banished to a motorway junction. Each station sits in the core of its ring, so that, by the original design rule, no home is more than about two kilometres from a station, and the shops, library and amenities are at the station plaza you can already cycle to. Mixed use is therefore not decoration; it is what makes the 15-minute distances real.
Why the mix matters more than the buildings
A green corridor with nothing to cycle to is a park, not a transport network. Houten works because the destinations, school, shop, station, sports hall, were deliberately scattered along the slow network at the planning stage. Separate the uses (housing here, retail by the motorway, jobs in a business park) and the bicycle stops being useful the moment you need to buy anything. Land-use mix is the hidden half of filtered permeability.
Governance and Finance
Design and planning are the theoretical part. The real test of a town like Houten is whether the machine behind it the budget, the payroll, the people who show up at the depot every morning, actually adds up. A town planner will not be convinced by cycle-path photos, they will ask where the money comes from, where it goes, who is paid to do the work, and what is set aside for the future.
This section answers those questions with Houten’s own 2026 figures[4].
Finances: Where the Money Comes From?
Houten’s total 2026 budget is about €151 million. If we translate to USD, that is ~$174 million. In Indian rupees, ~₹1,650 crore, for a town of just over 50,000 people.
Per resident, that works out to roughly €2,950 / $3,390 / ₹3.2 lakh per year. Crucially, Houten does not make most of this. Much of this funding is transferred from the Dutch central government.
| Source of income | EUR | USD | INR |
|---|---|---|---|
| Central government (gemeentefonds) | €90.1 m | $103.6 m | ₹982 cr |
| Area-development proceeds | €24.6 m | $28.3 m | ₹268 cr |
| Property tax (OZB) | €18.3 m | $21.0 m | ₹199 cr |
| Waste levy (afvalstoffenheffing) | €6.4 m | $7.4 m | ₹70 cr |
| Sewerage levy (rioolheffing) | €4.1 m | $4.7 m | ₹45 cr |
| Draw from general reserve | €4.2 m | $4.8 m | ₹46 cr |
| General fees / permits (leges) | €1.4 m | $1.6 m | ₹15 cr |
| Tourist & burial taxes | €0.5 m | $0.6 m | ₹5 cr |
| Total | €151 m | $174 m | ₹1,650 cr |
The single most important governance fact
About 60% of the budget is not raised locally, it is a block grant from The Hague. A Dutch town has limited power to grow its own income; its main lever is the property tax (OZB), which Houten raised for 2026 because central transfers are shrinking. This is the opposite of fiscal independence, and it is why every Dutch municipality watches the national “gemeentefonds circulaires” the way a farmer watches the monsoon.
Houten 2026 income: €151.1m / $173.8m / ₹1,647 cr
59.6%: Central government grant: €90.1m / $103.6m / ₹982 cr
The gemeentefonds: a national block grant from The Hague to the municipality.
16.3%: Area-development proceeds: €24.6m / $28.3m / ₹268 cr
Income from land and area-development activity.
12.1%: Property tax (OZB): €18.3m / $21.0m / ₹199 cr
The main locally raised tax on homes and non-residential property.
4.2%: Waste levy: €6.4m / $7.4m / ₹70 cr
Fee paid by households for waste collection and processing.
2.8%: Draw from general reserve: €4.2m / $4.8m / ₹46 cr
Using savings/reserves to balance the budget or fund planned needs.
2.7%: Sewerage levy: €4.1m / $4.7m / ₹45 cr
Fee for sewerage, drainage, wastewater, and related water-management costs.
1.0%: Other financial/organisational income: €1.5m / $1.7m / ₹16 cr
Other budgeted income listed in the municipal summary.
0.9%: General fees and permits: €1.4m / $1.6m / ₹15 cr
Fees for permits, documents, and municipal services.
0.3%: Tourist and burial taxes: €0.5m / $0.6m / ₹5 cr
Small local taxes from tourism and burial-related charges.
Municipal Finances: Where the Money Goes?
Houten’s 2026 budget is organised into six programmes. A programme is simply a large policy bucket: money grouped around a public purpose, not one single project.
The surprising lesson is this: Houten is famous for cycling and green planning, but most of its municipal spending is not on cycle paths or roads. It is on care, welfare, and social support.
Houten 2026 budget: €151.1m / $173.8m / ₹1,647 cr
51.0%: Social care and welfare: €77.1m / $88.7m / ₹840 cr
Youth care, Wet maatschappelijke ondersteuning, elderly and disability support, welfare, benefits, social participation.
20.2%: Green and future-proof Houten: €30.5m / $35.1m / ₹332 cr
Nature, housing, climate adaptation, sustainability, energy transition.
17.0%: Finance, overhead, and reserves: €25.7m / $29.6m / ₹280 cr
Municipal organisation, buffers, long-term finance, administration.
4.2%: Cycling, mobility, and road safety: €6.4m / $7.4m / ₹70 cr
Cycle routes, public transport, traffic safety, less car dominance.
4.0%: Safety and enforcement: €6.0m / $6.9m / ₹65 cr
Public order, police liaison, emergency coordination, digital safety.
3.6%: Democracy and resident services: €5.4m / $6.2m / ₹59 cr
Citizen participation, local democracy, service desk, resident involvement.
In this budget diagram, the width of each stream is based on euros. The labels also show the approximate dollar and Indian rupee equivalents using the same conversion used in the table: €1 ≈ $1.15 ≈ ₹109.
The chart shows the central budget lesson clearly: Houten is famous for cycling, but cycling and mobility are only a small part of municipal spending. The largest flow is the social domain: youth care, Wmo support, welfare, benefits, and support for residents who need help.
So the visible town, cycle paths, green routes, safe streets, is only one layer. Behind it sits the expensive layer: care, welfare, administration, maintenance, and municipal capacity.
Houten’s largest cost is social care, welfare, administration, and long-term municipal capacity.
Source: Gemeente Houten, Begroting 2026
Administration: Who actually runs the town?
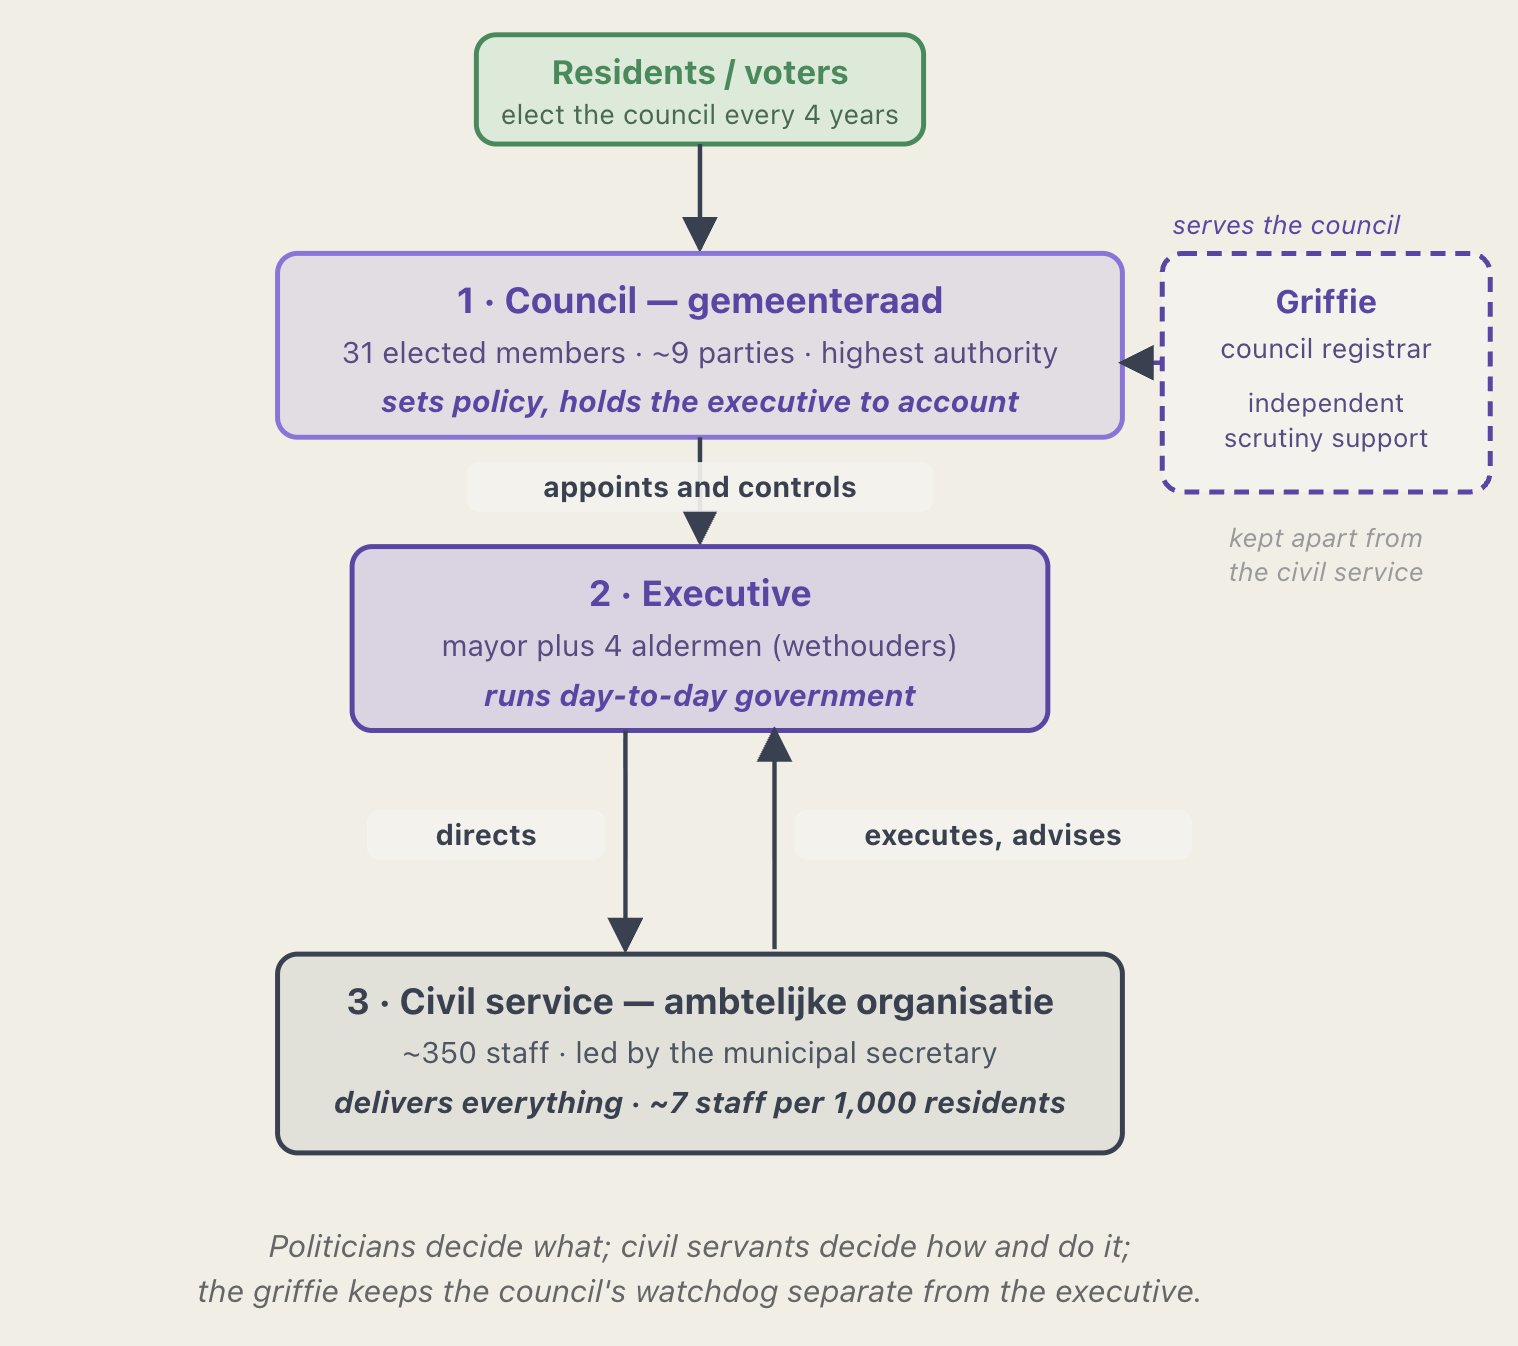
Houten is run by elected councillors, an executive of mayor and aldermen, and a professional civil service. The councillors decide the town’s direction, the executive manages the government, and the civil servants turn decisions into roads, parks, permits, budgets, services, and maintenance. The council has its own separate staff — the griffie — so it can supervise the executive independently.
What the politicians are paid — and who decides
None of these figures is set in Houten. Pay is fixed nationally by the Rechtspositiebesluit decentrale politieke ambtsdragers, scaled only to the town’s population class (Houten ≈ 51,000 residents), and indexed +3.5% for 2026. A council cannot vote itself a raise. Converted at €1 ≈ $1.15 ≈ ₹109.
| Office | Nature of pay | EUR / month | USD / month | INR / month |
|---|---|---|---|---|
| Councillor (raadslid) | allowance — part-time (~16–20 hrs/wk) | ~€1,900 | ~$2,185 | ~₹2.1 lakh |
| Alderman (wethouder) | salary — full-time | ~€9,500 | ~$10,925 | ~₹10.4 lakh |
| Mayor (burgemeester) | salary — full-time | €10,062.61 | $11,572 | ₹10.97 lakh |
The mayor’s figure is exact; the councillor and alderman rows are close estimates for Houten’s class. On top of the mayor’s base salary sit 8% holiday pay, a 9.8% year-end payment, a fixed €450 / $520 / ₹49,000 annual bonus, an untaxed expense allowance (ambtskostenvergoeding) of €412 / $474 / ₹45,000 net per month, and ABP pension. That brings the mayor’s all-in salary to roughly €143k / $164k / ₹1.56 crore a year, plus the expense allowance on top. Aldermen receive the same 8% holiday pay and an 8.3% year-end payment; councillors get no holiday pay but a small health-insurance contribution.
National range for context: aldermen run from €6,110 / $7,030 / ₹6.7 lakh per month in the smallest municipalities to €12,875 / $14,810 / ₹14 lakh in the largest; councillors from €1,306 / $1,500 / ₹1.4 lakh to €3,200 / $3,680 / ₹3.5 lakh.
The rupee figures are straight exchange-rate conversions, not purchasing-power: read ₹10.97 lakh/month as “a full Dutch mayoral wage,” not as what the role would or should pay in India.
Administration: Who actually keeps the green and the streets?
The crew that physically is Houten is remarkably small.
The Groenbeheer, Afvalbeheer en Buitendienst (GAB) team means Green, Waste and Outdoor Service. They maintain about 380 hectares of public green and 30 sports fields with a few dozen people, backed by a separate handful of enforcement officers.
Pay follows the national CAO Gemeenten scale, so it is not negotiated locally. Figures are gross, include the 17.05% benefits budget (IKB) in the annual column, and convert at €1 ≈ $1.15 ≈ ₹109.
| Role (CAO scale) | How many | Hours / week | Gross / month (EUR · USD · INR) | All-in / year incl. IKB (EUR · USD · INR) |
|---|---|---|---|---|
| Outdoor worker — green / waste / trees / grey (scale 5) | ~41 | 40 | €2,760–3,579 · $3,170–4,120 · ₹3.0–3.9 lakh | €39–50k · $45–58k · ₹42–55 lakh |
| Cluster lead / foreman (voorman, scale 7–8) | ~4 | 40 | €3,199–4,556 · $3,680–5,240 · ₹3.5–5.0 lakh | €45–64k · $52–74k · ₹49–70 lakh |
| Enforcement officer (BOA, scale 7) | 7 | 36 | €3,199–4,065 · $3,680–4,680 · ₹3.5–4.4 lakh | €45–57k · $52–66k · ₹49–62 lakh |
| Total public-realm crew | ~52 | — | — | ≈ €2.4m · $2.8m · ₹26 cr / year |
The outdoor service works a 40-hour week (against the 36-hour office standard), banking four “saved hours” a week as extra leave; the day starts at the gemeentewerf (municipal depot) with jobs handed out over coffee, and in winter the same crew runs the gritting rota.
Waste Management in Houten: Self-Reliance
Houten runs its own waste system end to end, and, importantly, it is fully cost-recovered: the municipality owns every bin, underground container, and recycling skip, and every cent of the cost is covered by the household waste levy (afvalstoffenheffing) rather than the general budget. This is the “polluter pays” principle applied cleanly.
Team GAB (~45 people) maintains the green, waste and outdoor service, split into four clusters, waste/recycling, green, trees, and “grey” (paving, sweeping), plus a separate 7-FTE enforcement (BOA) team for fly-tipping and dumping.
For context, the whole municipality runs on ~350 staff. Pay is set nationally by the CAO Gemeenten scale, not locally.
| Role (CAO scale) | How many | Hrs / wk | Gross / month | All-in / year, incl. IKB |
|---|---|---|---|---|
| Outdoor / waste worker (scale 5) | ~41 | 40 | €2,760–3,579 $3,170–4,120 ₹3.0–3.9 L |
€39–50k $45–58k ₹42–55 L |
| Foreman / cluster lead (scale 7–8) | ~4 | 40 | €3,199–4,556 $3,680–5,240 ₹3.5–5.0 L |
€45–64k $52–74k ₹49–70 L |
| Enforcement officer / BOA (scale 7) | 7 | 36 | €3,199–4,065 $3,680–4,680 ₹3.5–4.4 L |
€45–57k $52–66k ₹49–62 L |
The split of the ~45-person team between clusters isn’t separately published, the council reports only the team total. Rupee figures are exchange-rate conversions, not purchasing power, read ₹3 L/month as “a full Dutch professional wage.”
On top of salary: ABP pension, 8% holiday pay, a year-end bonus, 28 days’ leave, and employer-paid health insurance. The outdoor crew works a 40-hour week (banking four “saved hours” weekly as extra leave), starting at the depot at dawn; in winter the same crew runs the gritting rota.
The system’s resilience is in how absence is handled. A sick worker is paid 100% of salary for 52 weeks, then 70% for weeks 53–104, cannot be dismissed during that time, and the employer must actively help them back to work, while the bins still get emptied via standby rosters and temporary hire, which is why part of the budget is ring-fenced for cover. The through line is a real career ladder for a manual job, a one year contract leading to a permanent one, with training through the in-house Houten Academie, which is how the crew stays small, skilled and stable rather than large and casual.
Finances: Taxes for Residents
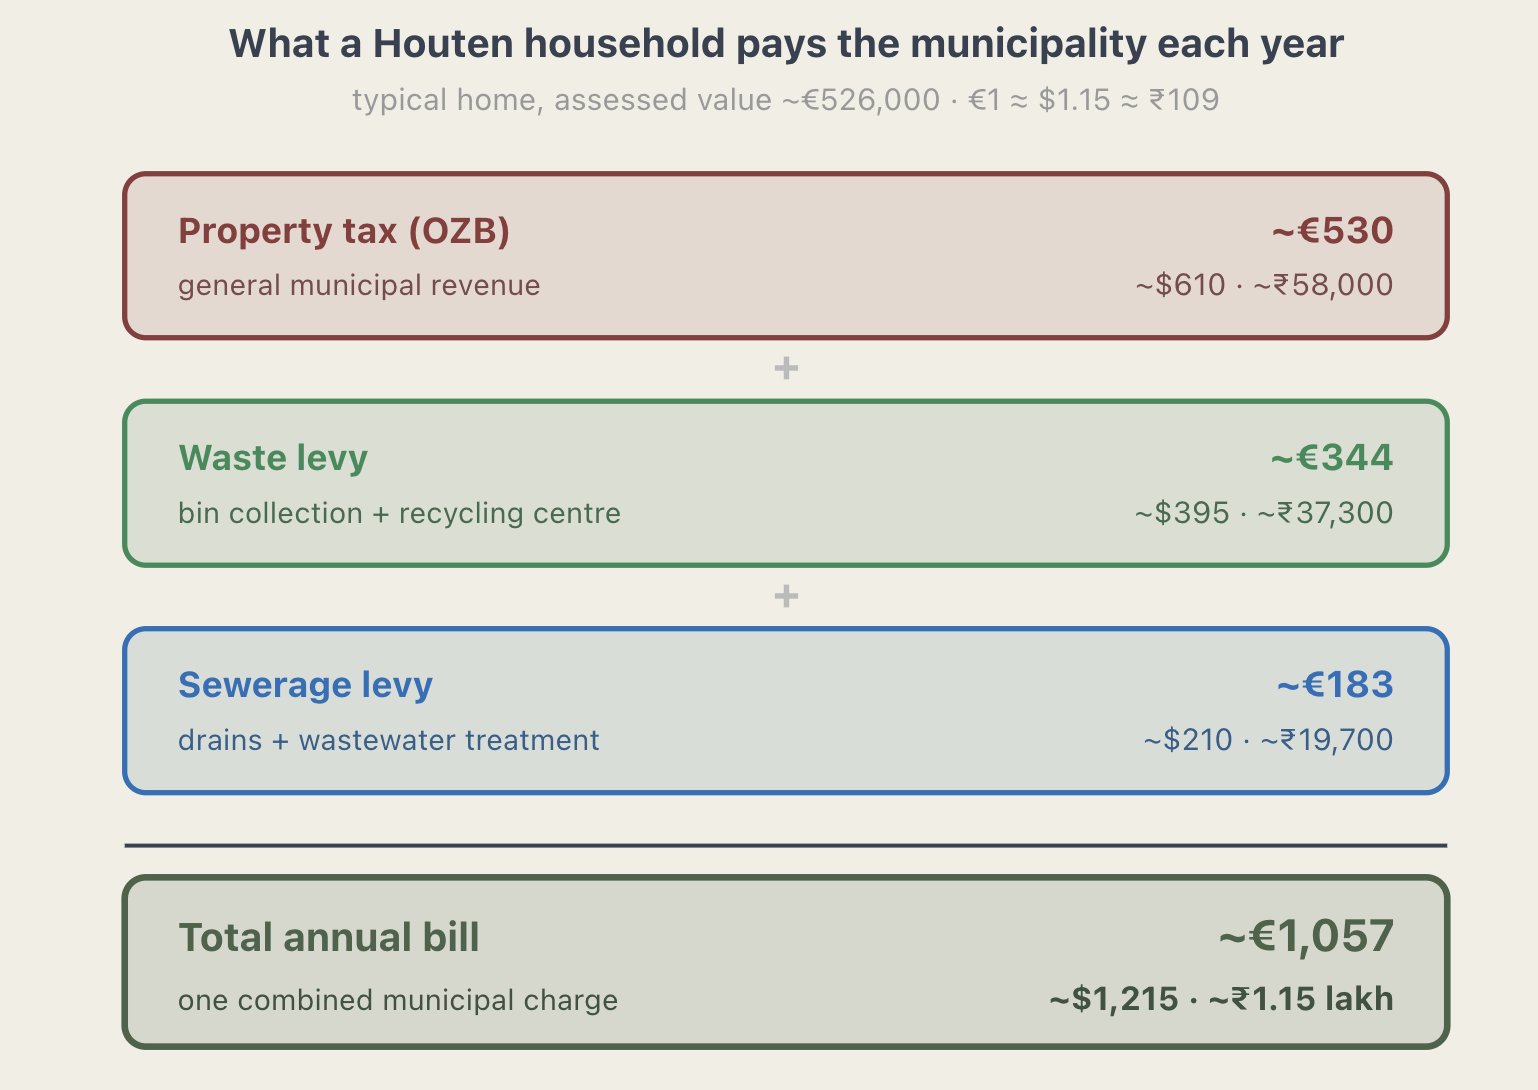
A Houten household gets one annual municipal bill of three charges. On a typical home (assessed value ~€526,000), at €1 ≈ $1.15 ≈ ₹109:
| Charge | What it covers | EUR / yr | USD / yr | INR / yr |
|---|---|---|---|---|
| Property tax (OZB) | General municipal revenue — not earmarked | ~€530 | ~$610 | ~₹58,000 |
| Waste levy (afvalstoffenheffing) | Bin collection + recycling centre | ~€344 | ~$395 | ~₹37,300 |
| Sewerage levy (rioolheffing) | Drains + wastewater treatment | ~€183 | ~$210 | ~₹19,700 |
| Total | ~€1,057 | ~$1,215 | ~₹1.15 lakh |
OZB runs at roughly 0.10% of a home’s assessed (WOZ) value, reset yearly — a €300,000 home pays ~€253, Houten’s pricier average home ~€530. For 2026 the council raised local taxes 15% to close a shortfall, yet household taxes here stay low compared with neighbouring towns.
The part that matters for how the town is funded: the three charges work in two completely different ways.
The waste and sewerage levies are cost-recovery by law they can only recoup the cost of those services, never turn a profit. The property tax (OZB) is the opposite: general revenue that funds everything the levies don’t roads, the green-blue network, parks, schools, social care, so it maintains the town only indirectly, and is not a ring-fenced maintenance tax.
And the biggest income source isn’t local tax at all, it’s the central-government transfer (the gemeentefonds). That dependence is exactly why cuts to those transfers tipped Houten’s 2026 budget into the “ravijnjaar” crisis and forced the unpopular 15% OZB rise.
Acknowledgements
Special thanks to Calvin Andriga, from Beverwijk, The Netherlands. He attended Johan Cruyff College in Amsterdam. He opened my eyes to the importance of Dutch urban planning and Water management I am thankful for his support and guidance.

References
[1]
Encyclopædia Britannica, “Netherlands.” Encyclopædia Britannica, Inc. Available: https://www.britannica.com/place/Netherlands
[2]
CROW, Design manual for bicycle traffic, English. Ede, The Netherlands: CROW, 2016.
[3]
OpenStreetMap contributors, “Houten street-network data.” OpenStreetMap, 2026. Available: https://www.openstreetmap.org/
[4]
Gemeente Houten, “Begroting 2026 in één oogopslag,” 2025. Available: https://www.houten.nl/gemeentelijke-organisatie/wet-en-regelgeving/begrotingen-jaarrekeningen-en-jaarverslagen